Welcome back to the blog survival guide, where I am the one who actually needs the guiding! This week in my web design class we focused on infographics. Continue reading to find out how graphics help us in several ways.
Infographics are visual representations of:
- information
- data
- knowledge
- all to portray content to viewers quickly and clearly

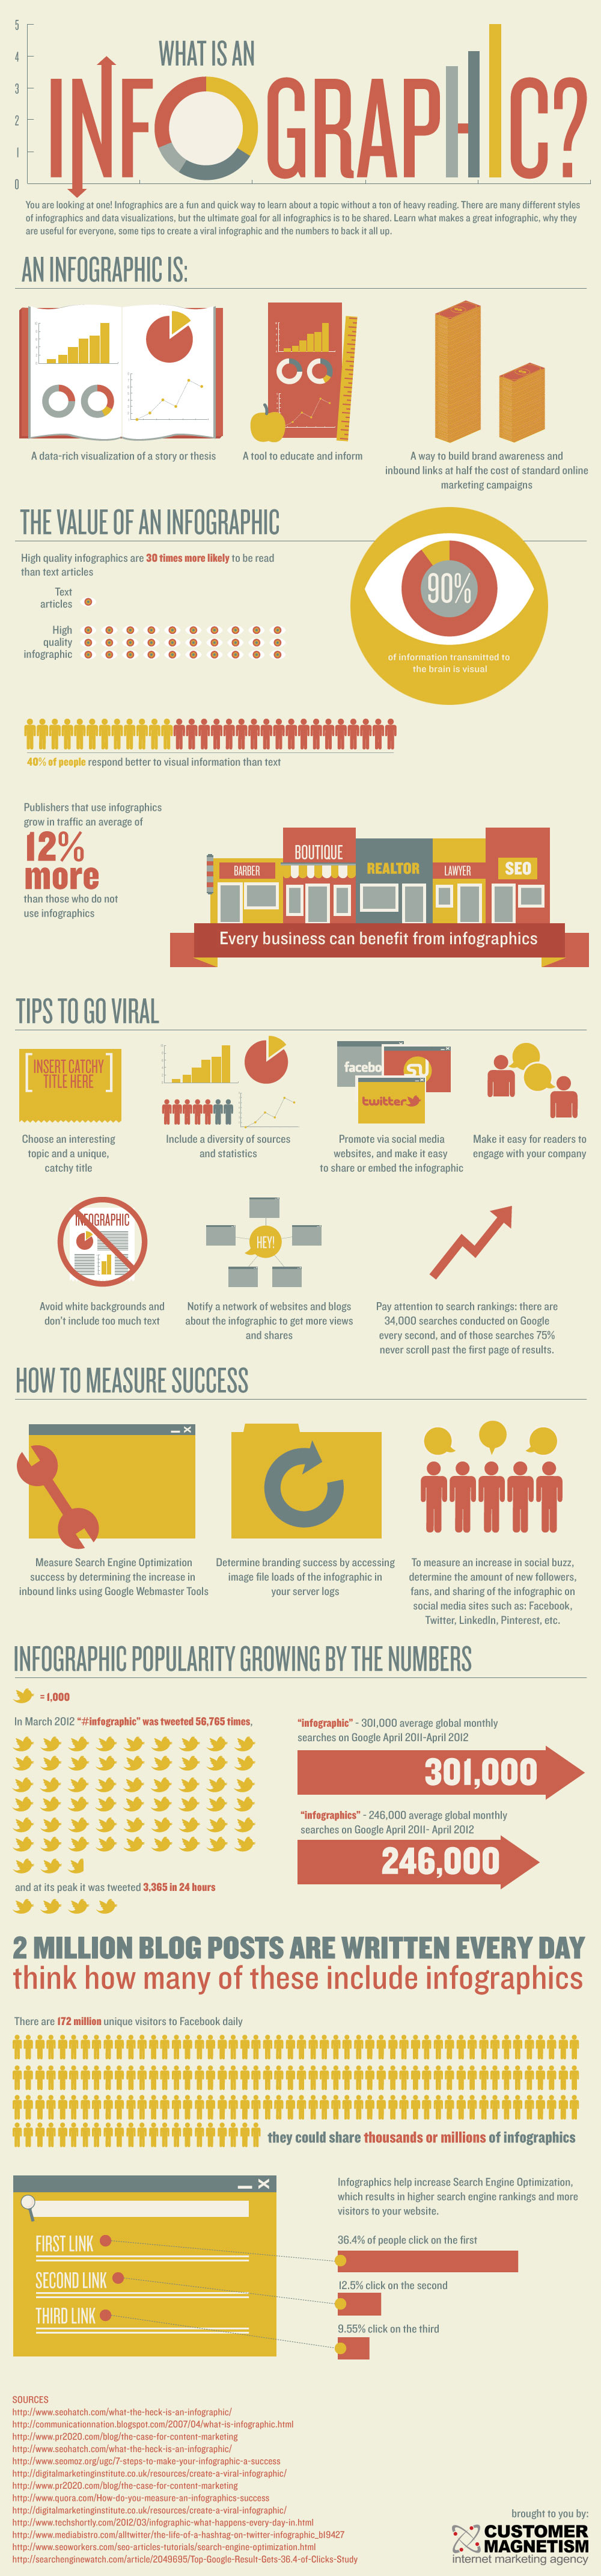
I find infographics very useful and a good idea to incorporate on web pages for visual learners like me. Infographics allow viewers to see complex subjects broken down in a different way.
For Those Who Are New to the Creating Process:
- Make sure your content is appealing and accessible– I believe it is best to catch the audience’s eye as soon as they take a glance at your graphic, so make sure you incorporate a great attention grabber.
- Include clear and concise data– The date that you want your audience to obtain should not be too confusing to understand. Anyone should be able to decipher the message intended to be conveyed.

- Have a great grasp on your topic– it is important that your audience can trust the fact that you know what you are talking about. Your facts should be accurate before you throw them onto your infographic.
- Be Yourself– (a common tip that is often given but should always be remembered) Make sure that you remain true to yourself while creating an infographic because it will guide you to produce the best content in your eyes.
information adapted from: What is an Infographic? ( examples, tips, and templates)
